Cloudiness
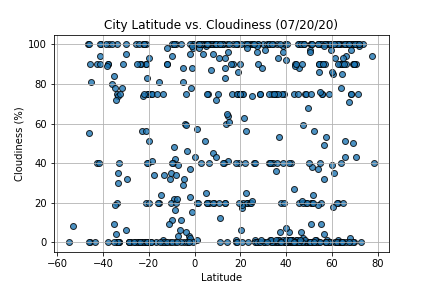
The scatter plot shows is no relationship at all between latitude and cloudiness, however, it is interesting to see that strong linear bands of cities sit at 0, 20, 40, 75, and 100% cloudiness.
Statistical Analysis
Northern Hemisphere
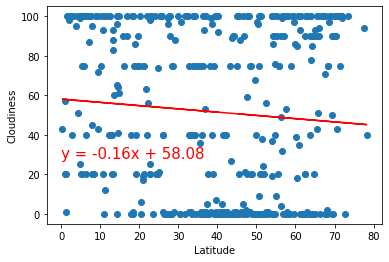
The R-squared value for the northern hemisphere was an extremely low 0.0064.
Southern Hemisphere
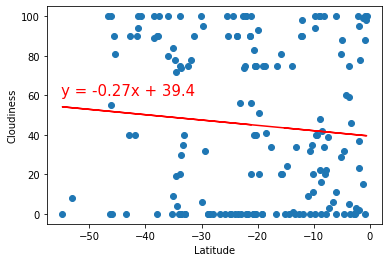
Cities located in the southern hemisphere also produced a poor R-squared value of 0.0084.
Conclusion
The statistical analysis calculated how less than 1% of cloudiness can be attributed to changes in latitude. Thus, there is no relationship at all between the two variables.
