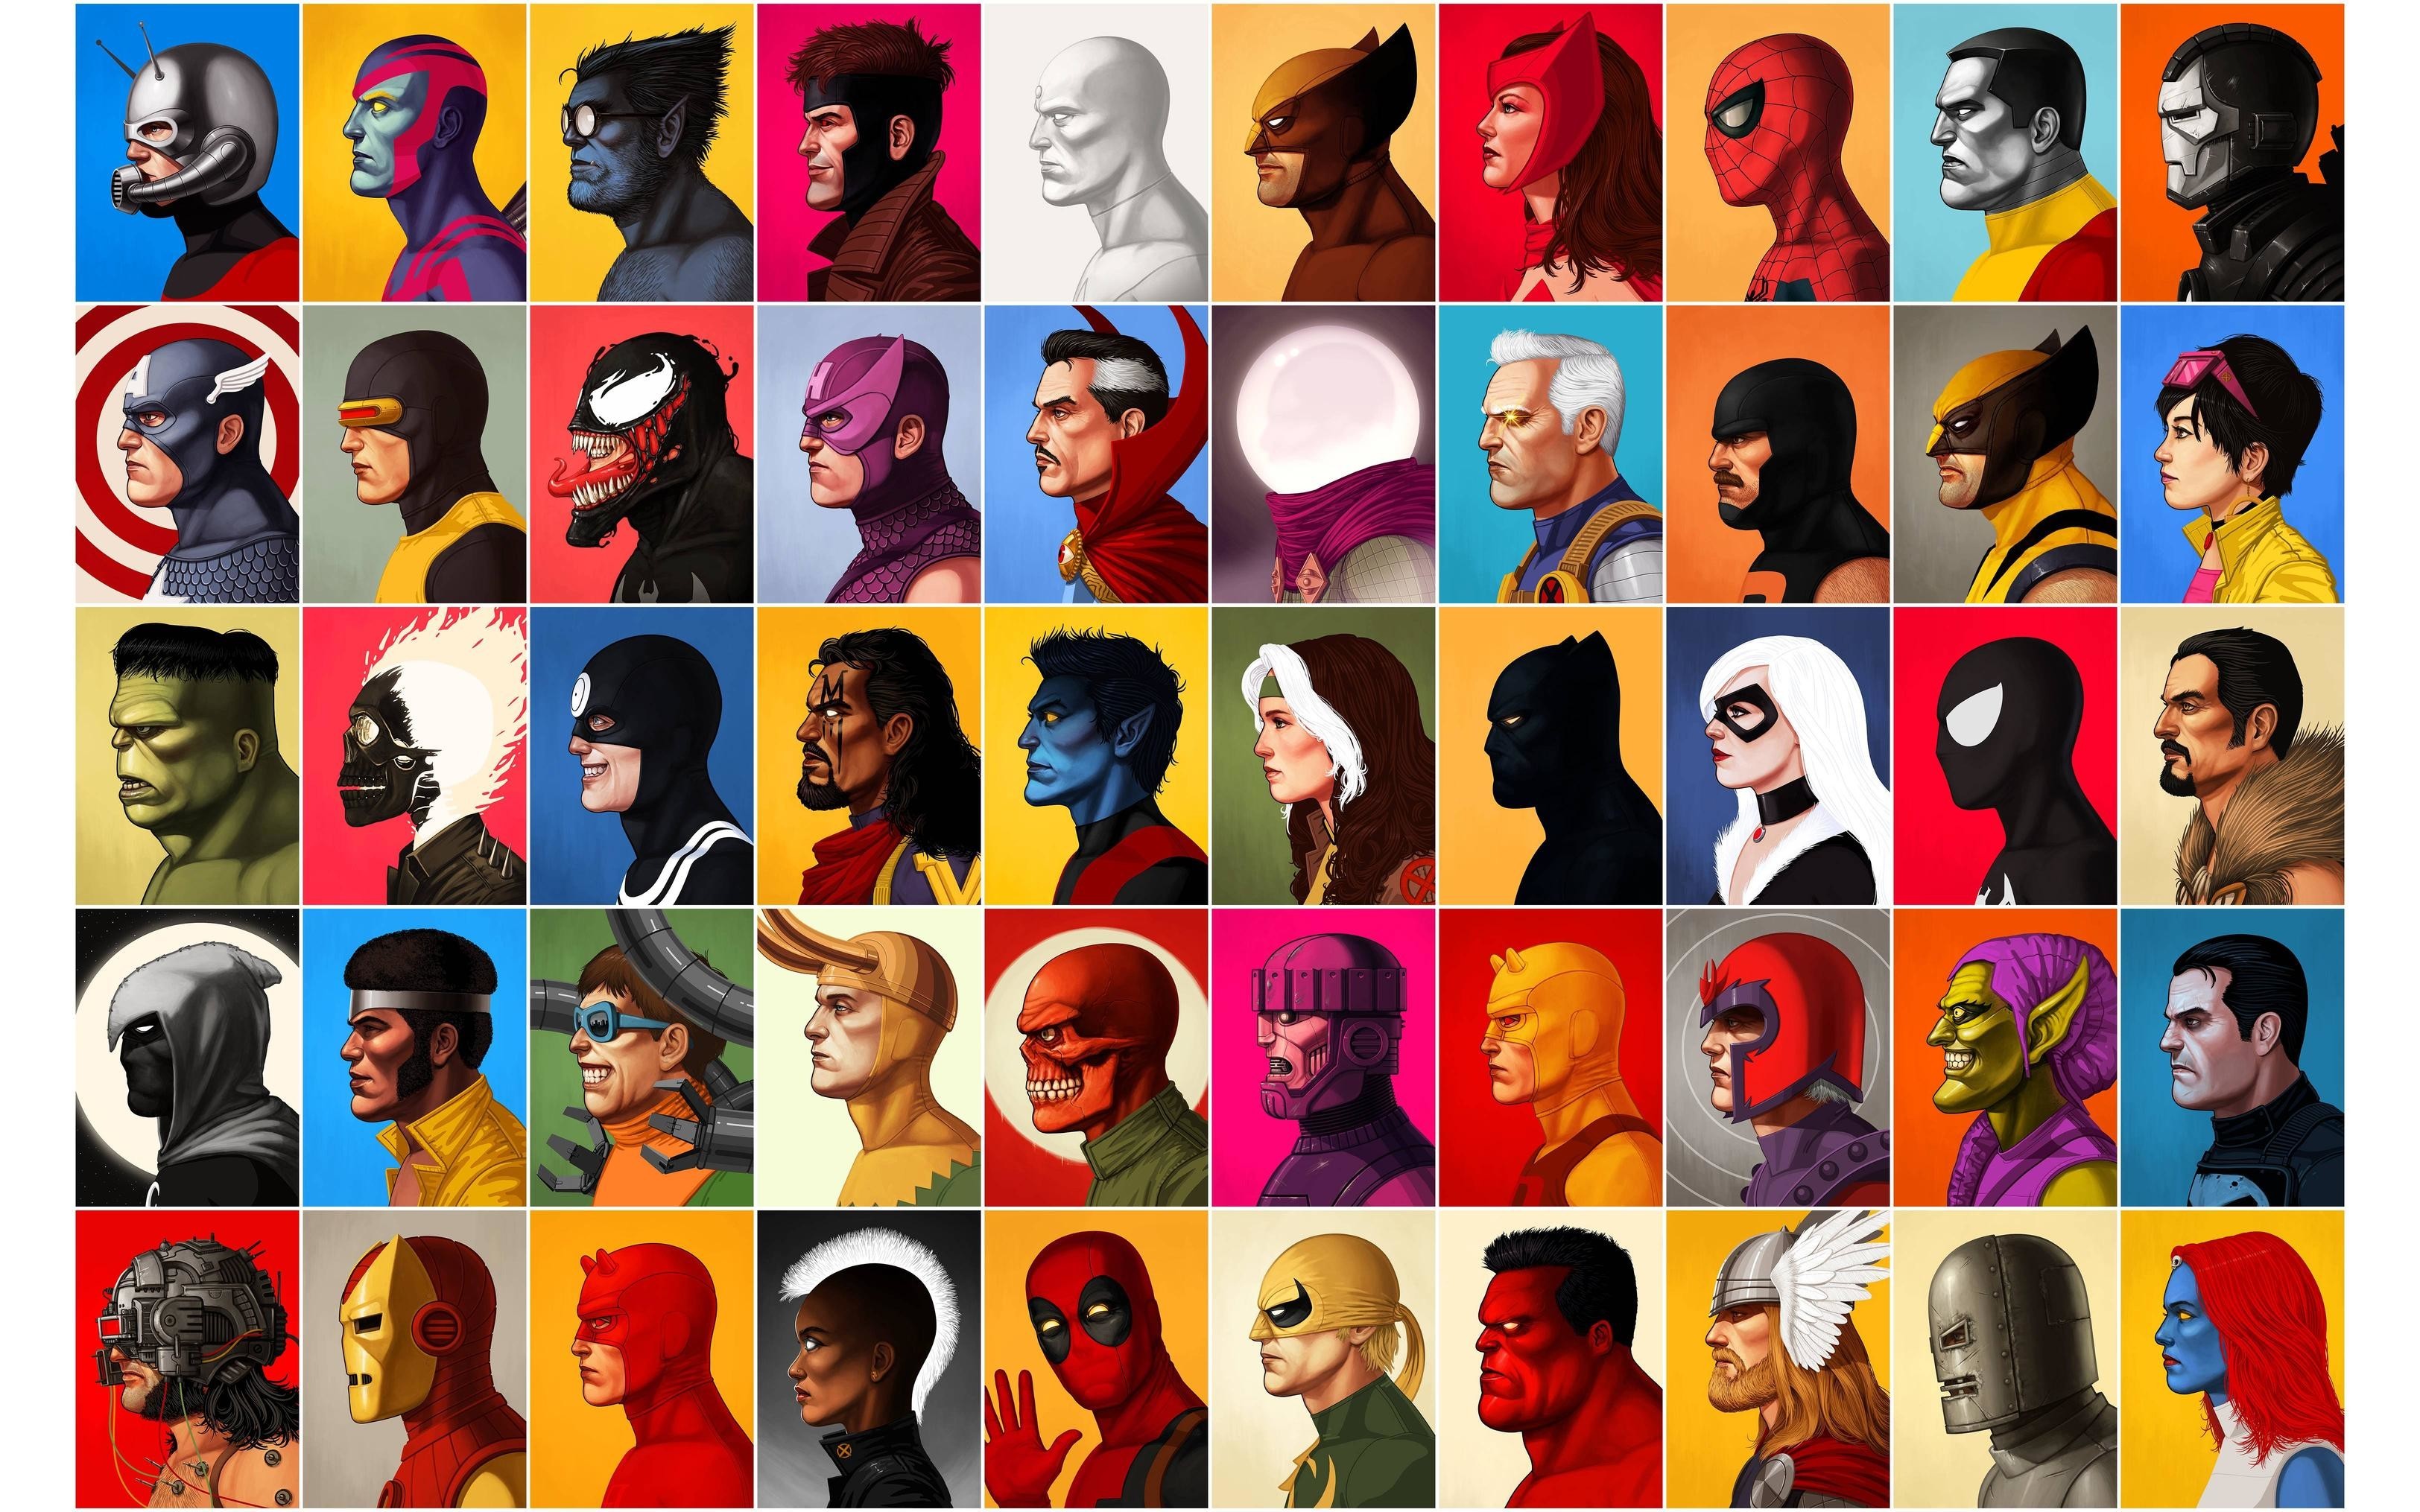
About

Since its creation in 1939 by Martin Goodman, Marvel Comics has grown into a huge blockbuster entity that creates cinematic renditions of its most famous characters whose stories were humbly created in comic books several decades before. The Marvel era officially begain in 1961, when the company launched the The Fantastic Four and superhero titles created by Stan Lee amongst others. Stan Lee is responsible for creating Marvel's most well-known superheroes such as Captain America, Spider-Man, Iron Man, Wolverine, the Hulk, Thor, Ant-Man (Giant), the Wasp, Doctor Strange, Scarlet Witch, Invisible Woman, and Thing. Most of Marvel's fictional characters operate in a single reality known as the Marvel Universe, though this universe has been further depicted as being comprised of a "multiverse" of thousands of separate universes.
This data visualization project delves into the universe, initially looking at its general history, its complex entirity, and then specifics on the 20 most-networked and well-known superheros, as well as what makes them superheroes in the first place. Datasets on character history and demographics were initially obtained from Kaggle and Marvel's official wiki. Databases were then created from the initial CSV files, which employed Python via Jupyter Notebook, Microsoft Excel, and SQL. D3.js was used extensively to create the interactive visualizations seen here via HTML, CSS, and Javascript.
The different tabs sequentially navigate you from one interactive visualization to the next. User prompts are highlighted in red above each visualization.
Data sets Used:
https://www.kaggle.com/dannielr/marvel-superheroes?select=charcters_stats.csv
https://www.kaggle.com/fivethirtyeight/fivethirtyeight-comic-characters-dataset?select=marvel-wikia-data.csv
https://marvel.fandom.com/wiki/Power_Grid
Marvel Images:
https://img.wallpapersafari.com/desktop/1920/1080/44/13/g1NGvx.jpg
https://wallpaperset.com/w/full/d/6/8/526989.jpg